


These therapist statistics and demographics will shock you.
Based on research from Zippia, we've compiled the latest statistics about therapists, including:
- How many therapists are there?
- Average age of a therapist
- Percentage of therapists that are male vs. female
- Most common ethnicities for therapists
- Average therapist salary
- Much more
So, keep reading to find the latest therapist statistics and demographics.
Key Therapist Statistics To Know
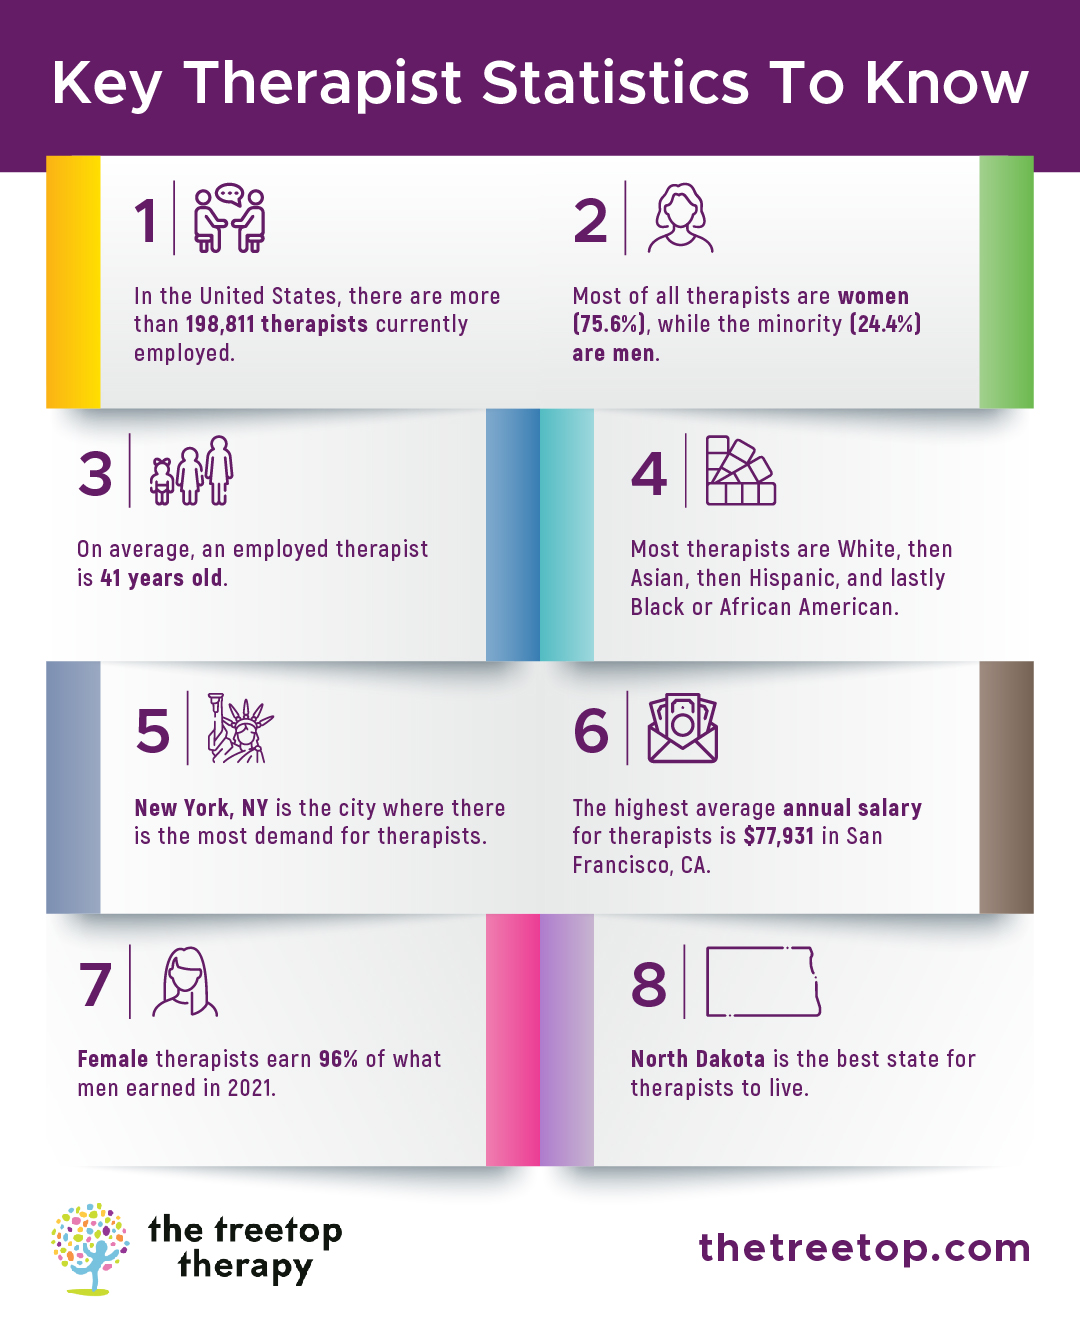
- In the United States, there are more than 198,811 therapists currently employed.
- Most of all therapists are women (75.6%), while the minority (24.4%) are men.
- On average, an employed therapist is 41 years old.
- Most therapists are White, then Asian, then Hispanic, and lastly Black or African American.
- New York, NY is the city where there is the most demand for therapists.
- The highest average annual salary for therapists is $77,931 in San Francisco, CA.
- Female therapists earn 96% of what men earned in 2021.
- North Dakota is the best state for therapists to live.
How Many Therapists Are There In The U.S?
In the United States, there are more than 198,811 therapists currently employed.

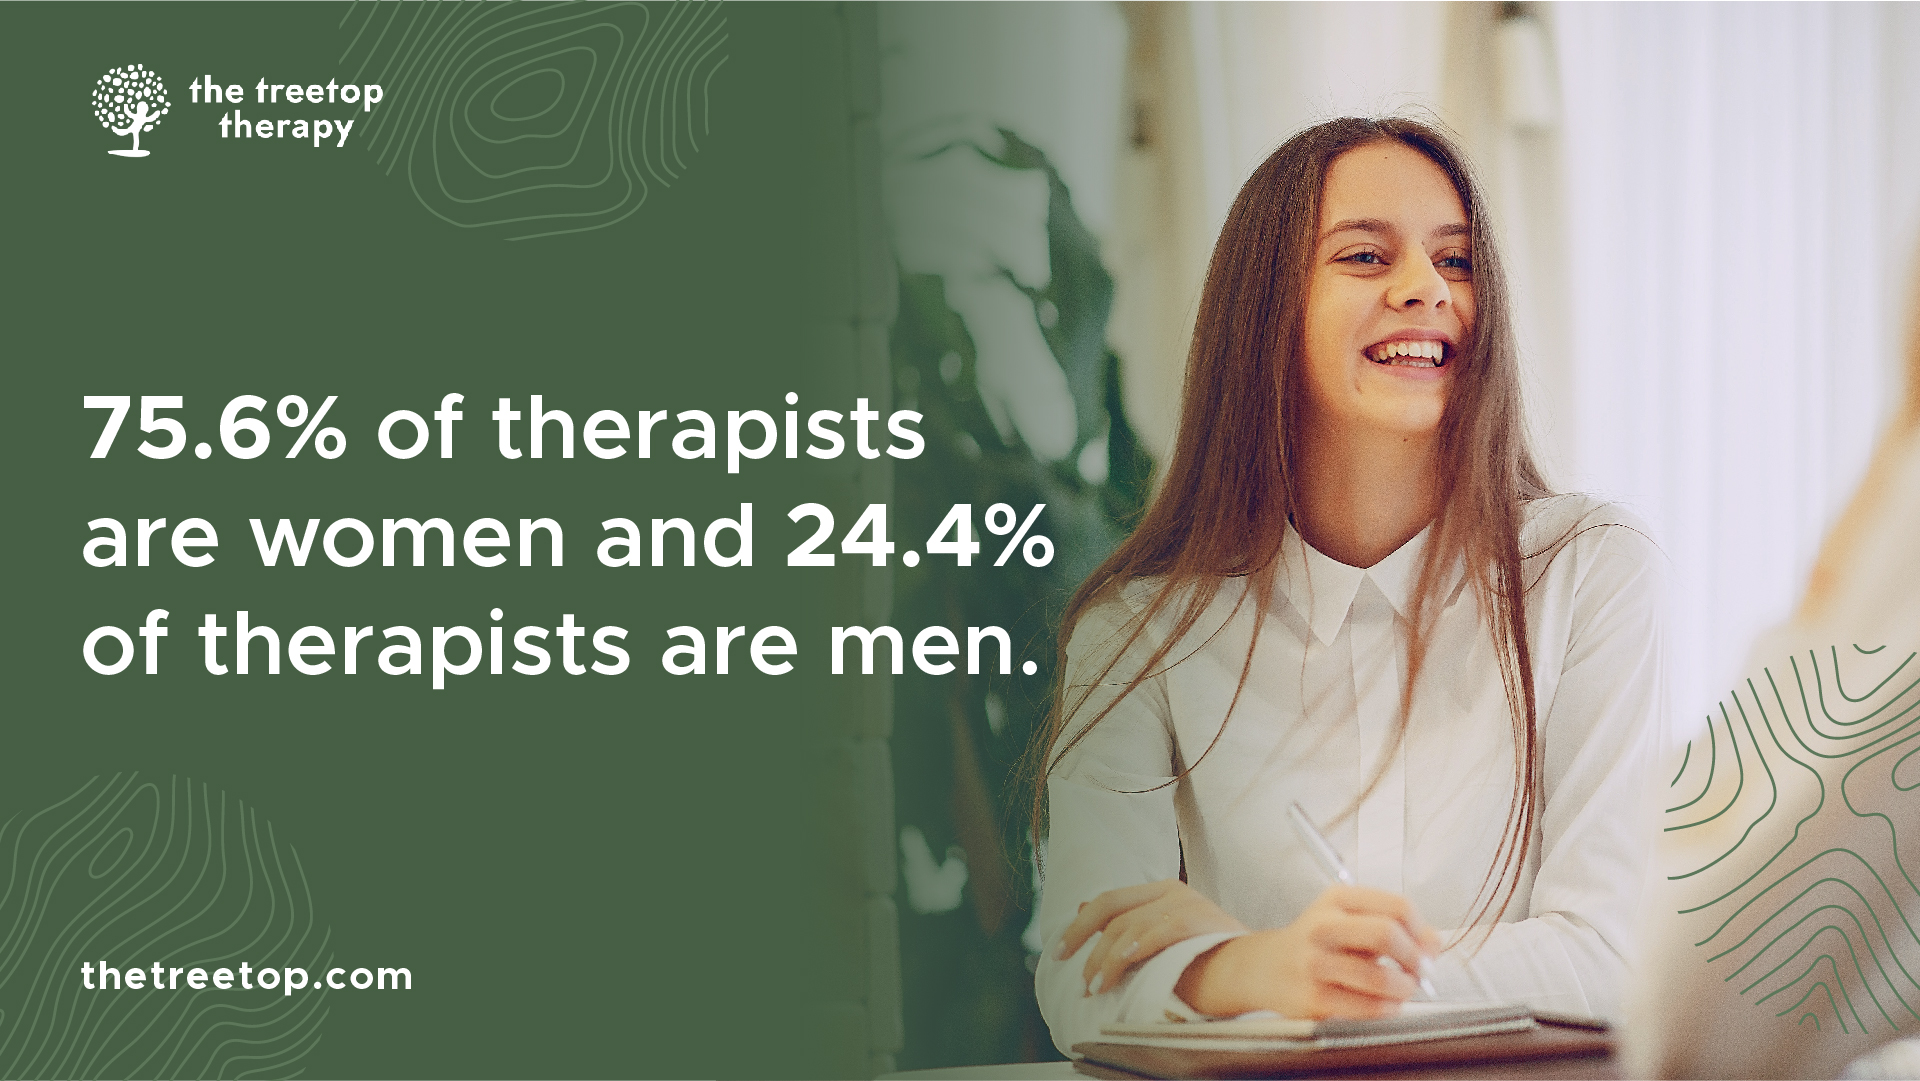
Therapist Statistics By Gender
75.6% of therapists are women and 24.4% of therapists are men.
Below is a chart that shows therapists' gender by year:
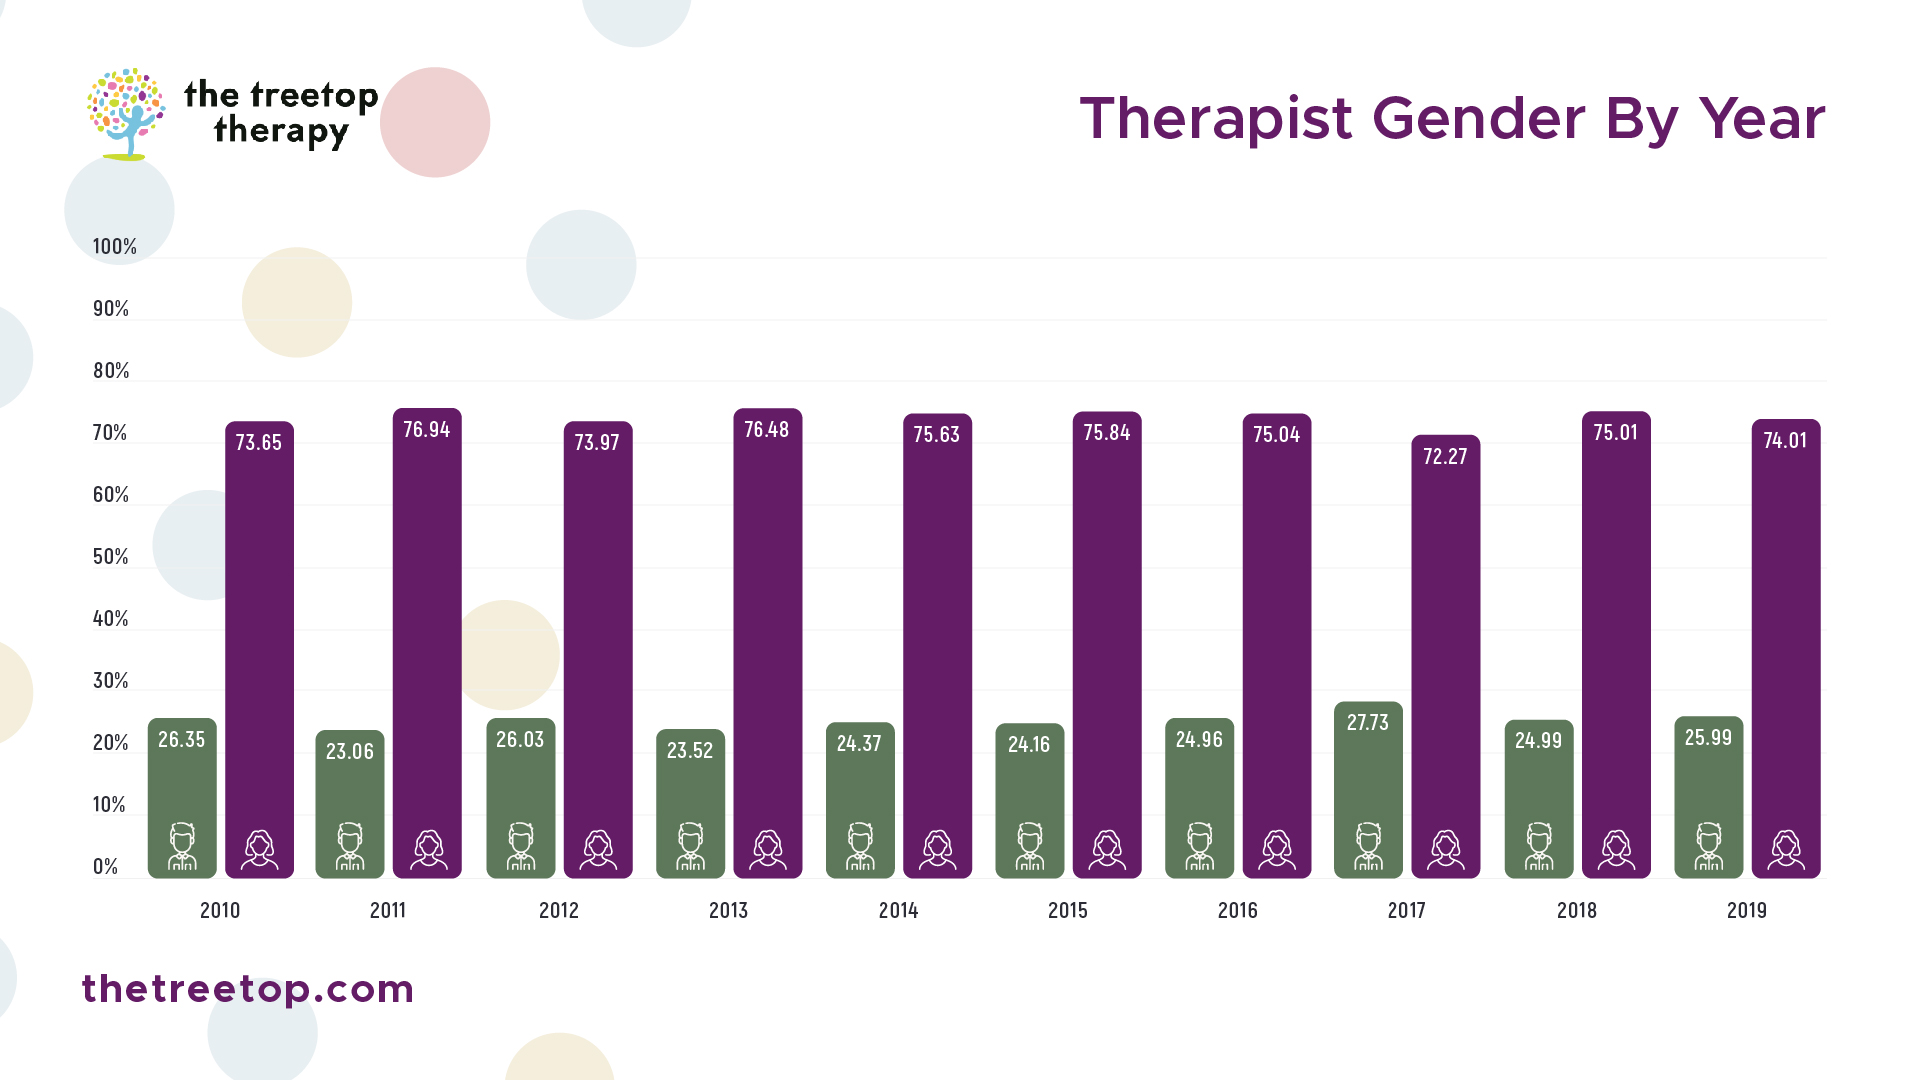
| Year | Male | Female |
| 2010 | 26.35% | 73.65% |
| 2011 | 23.06% | 76.94% |
| 2012 | 26.03% | 73.97% |
| 2013 | 23.52% | 76.48% |
| 2014 | 24.37% | 75.63% |
| 2015 | 24.16% | 75.84% |
| 2016 | 24.96% | 75.04% |
| 2017 | 27.73% | 72.27% |
| 2018 | 24.99% | 75.01% |
| 2019 | 25.99% | 74.01% |
| Gender | Percentages |
| Female | 75.6% |
| Male | 24.4% |
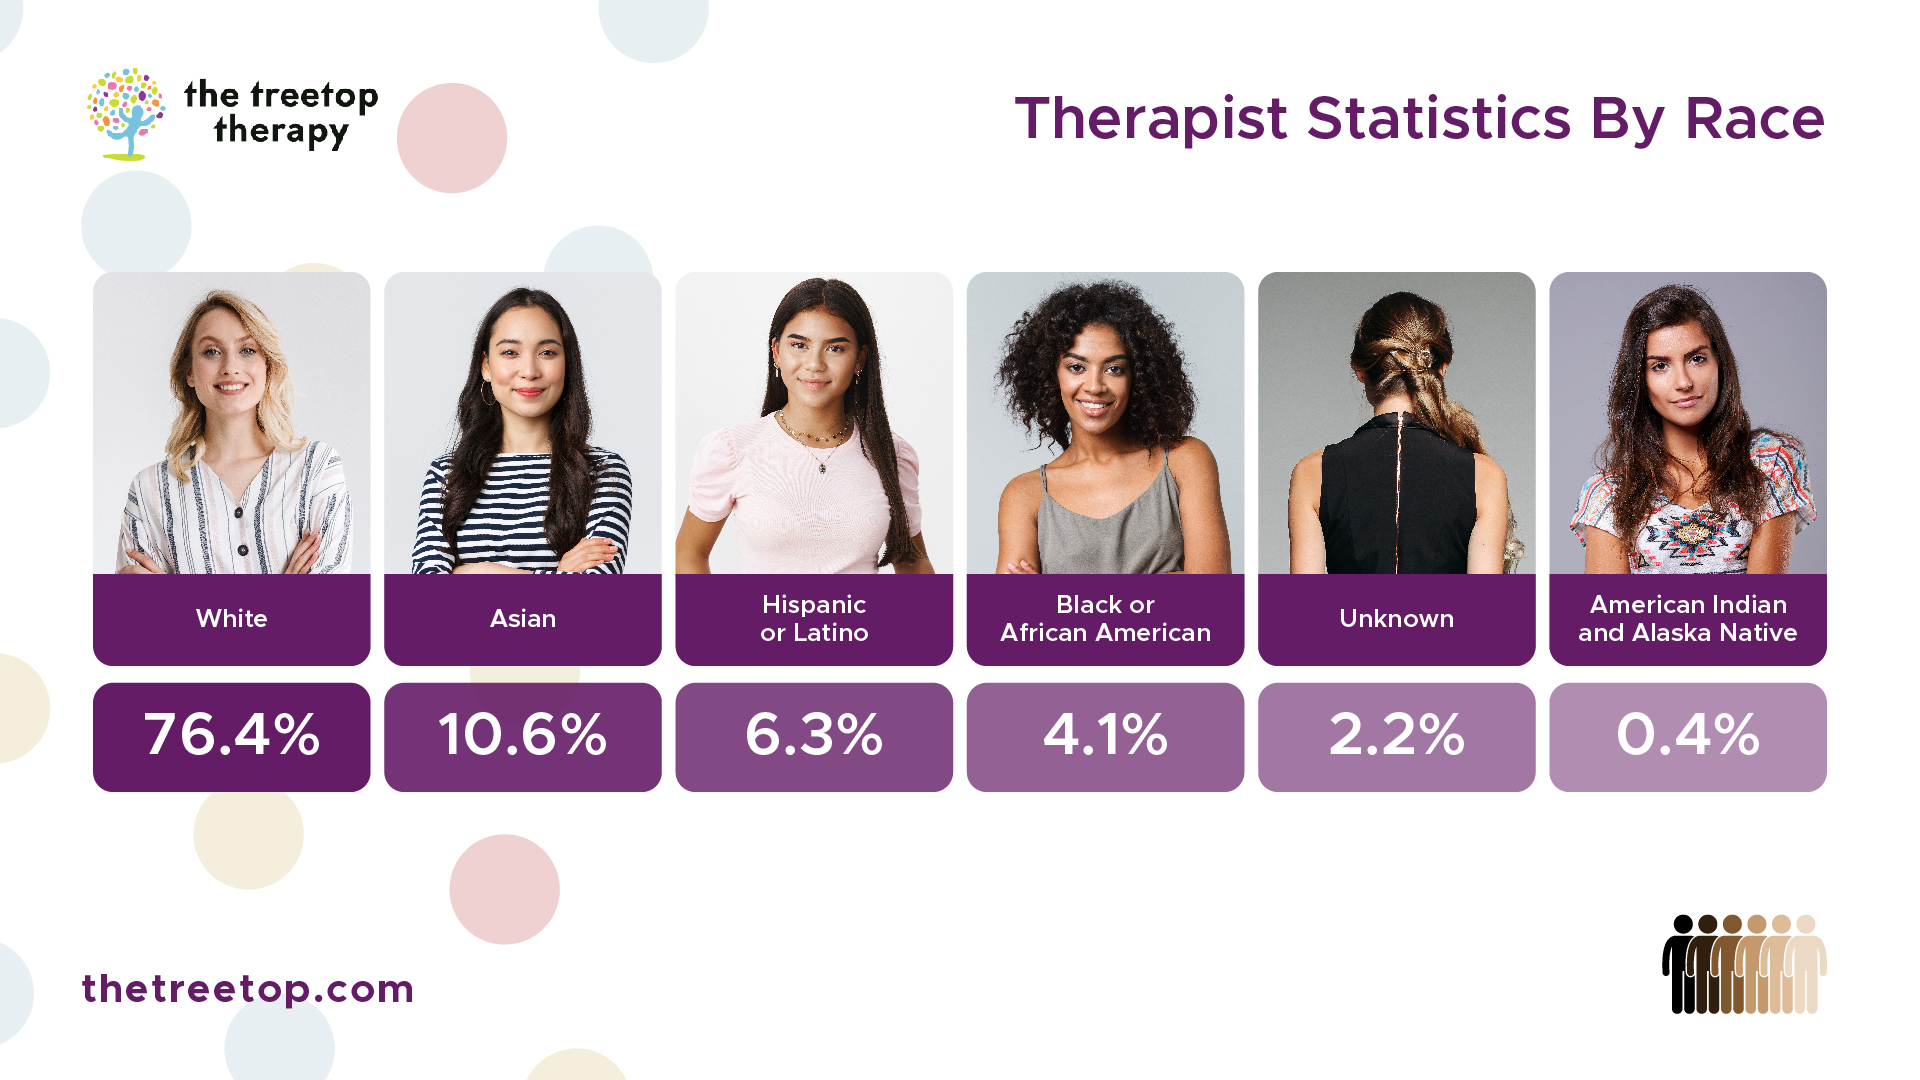
Therapist Statistics By Race
76.4% of therapists are White, 10.6% of therapists are Asian, 6.3% are Hispanic.
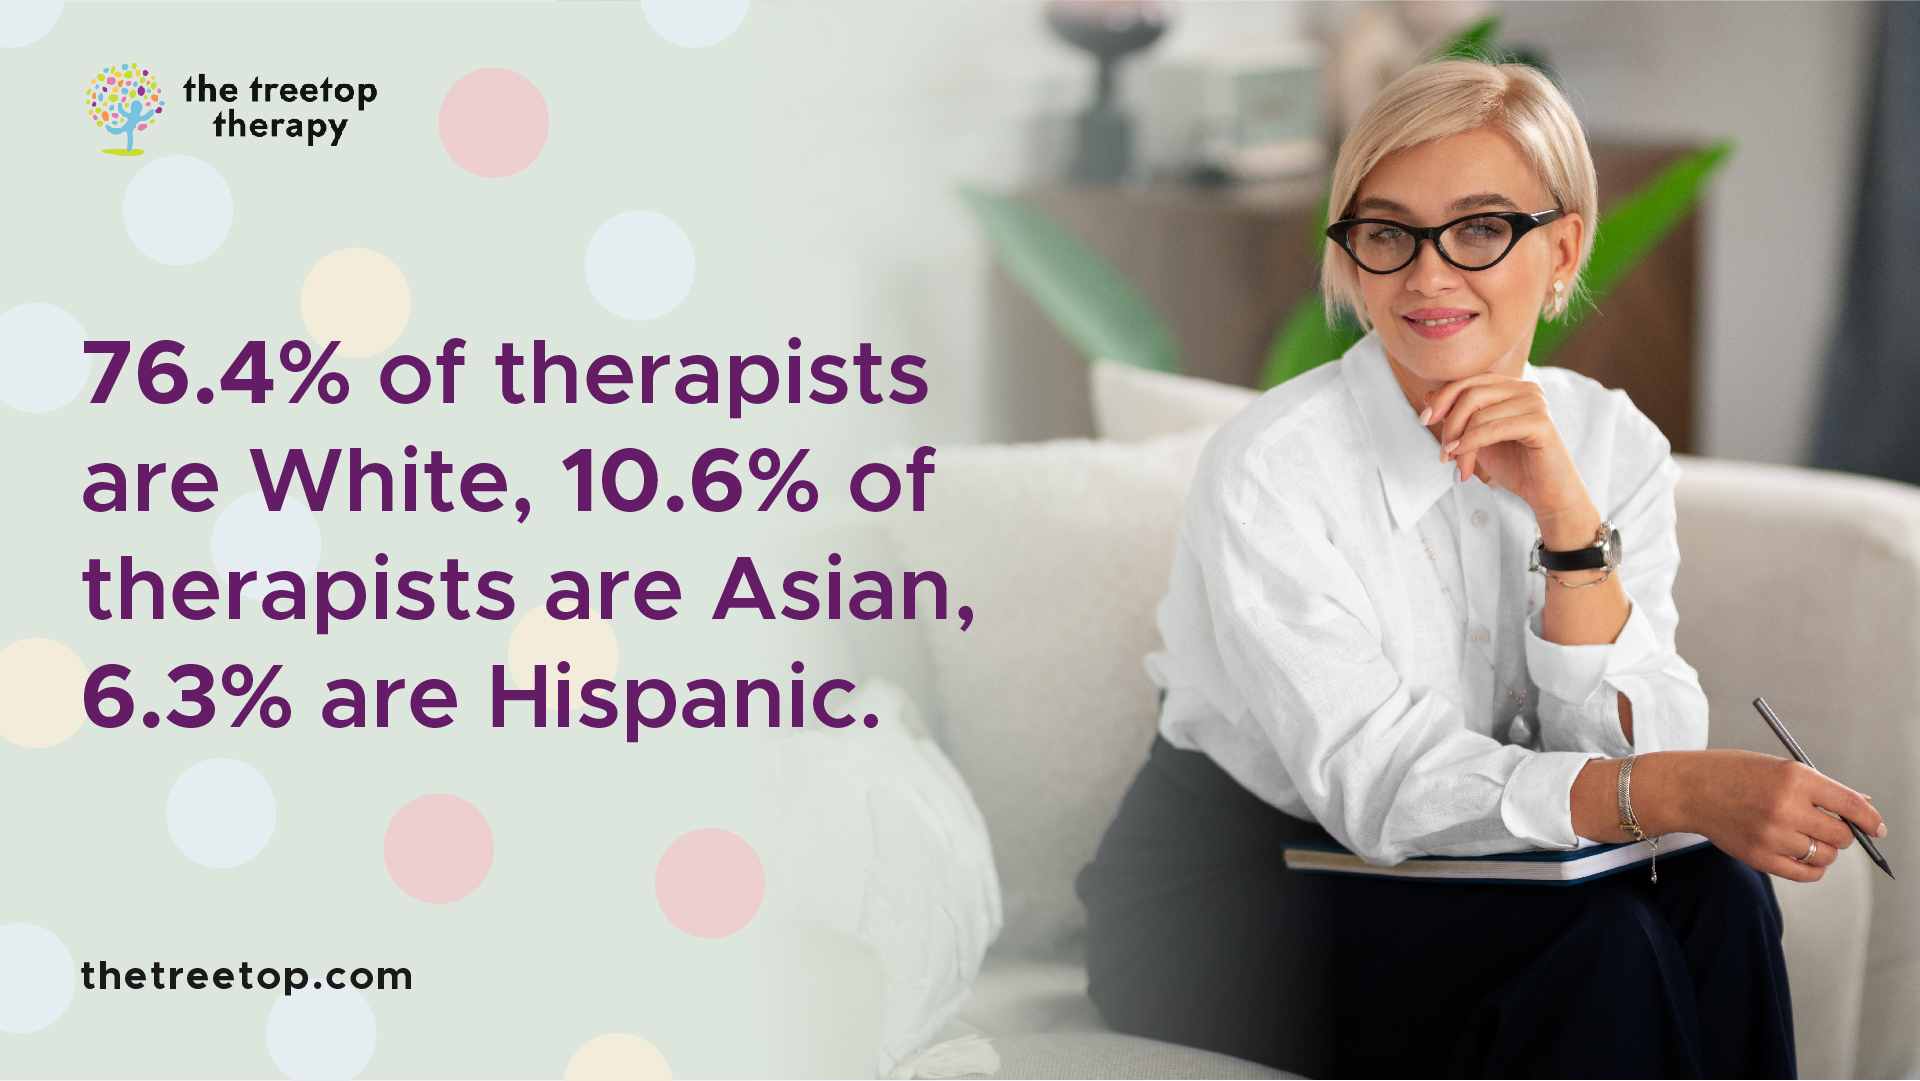
| Therapist Race | Percentages |
| White | 76.4% |
| Asian | 10.6% |
| Hispanic or Latino | 6.3% |
| Black or African American | 4.1% |
| Unknown | 2.2% |
| American Indian and Alaska Native | 0.4% |
Over time, the prevalence of therapists in each race has changed:
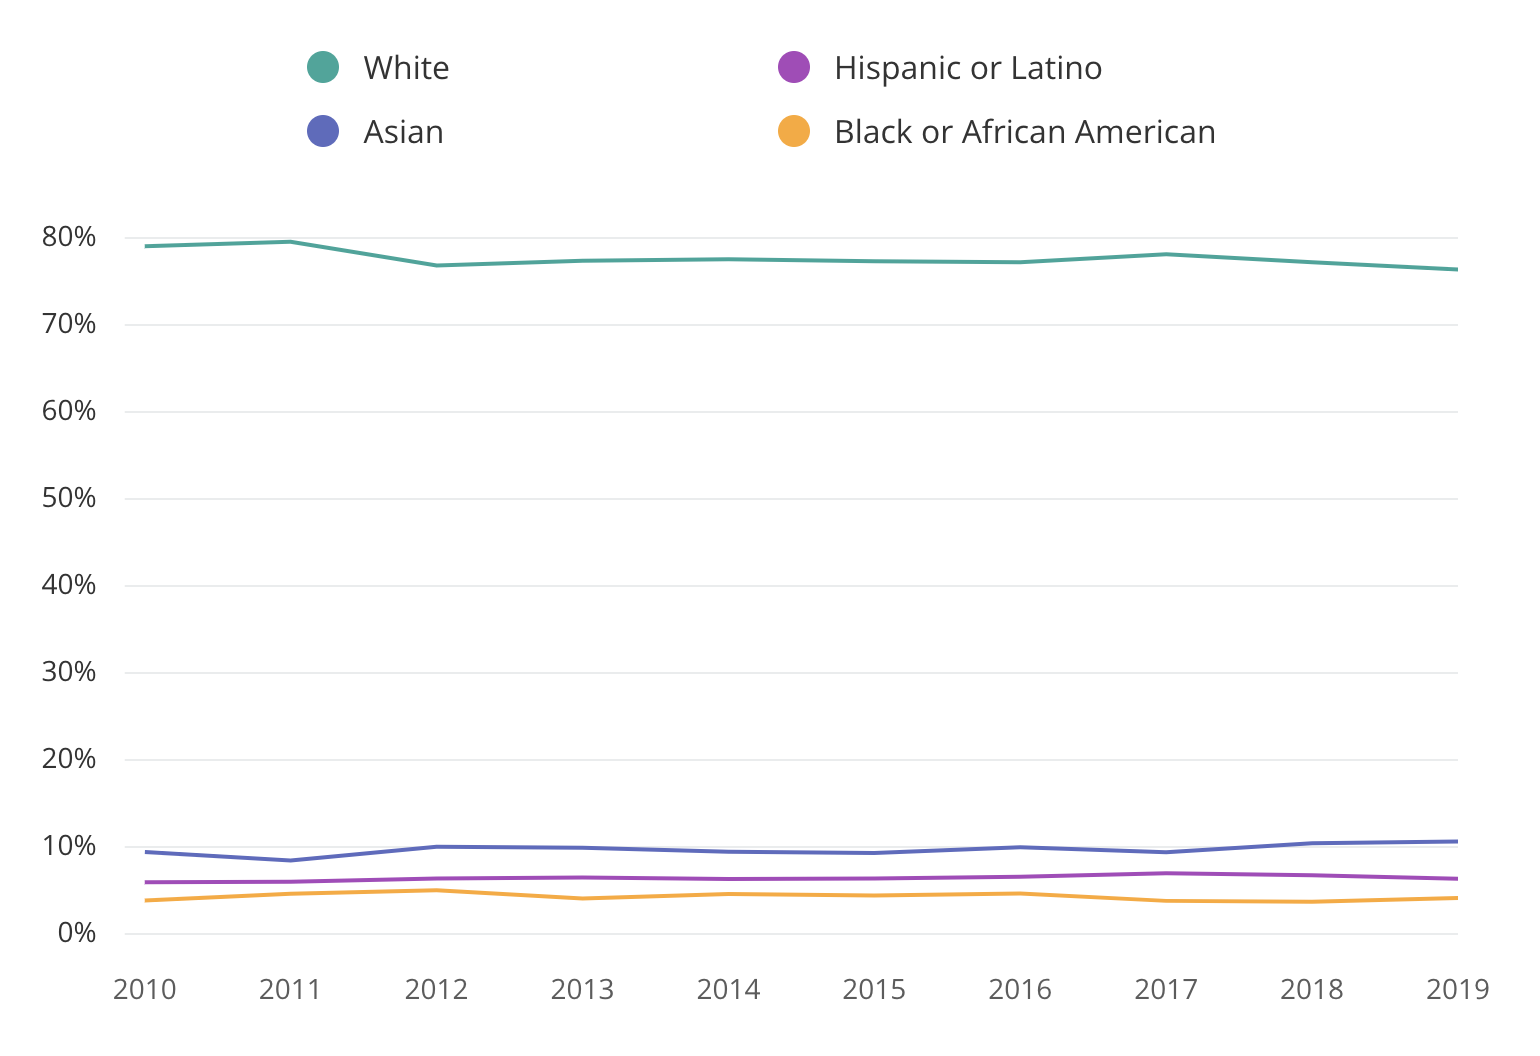
And every year that goes by, the percentage of therapists in each race changes:
| Year | White | Black or African American | Asian | Hispanic or Latino |
| 2010 | 79.03% | 3.85% | 9.41% | 5.94% |
| 2011 | 79.54% | 4.62% | 8.45% | 6.01% |
| 2012 | 76.82% | 5.04% | 10.02% | 6.37% |
| 2013 | 77.37% | 4.08% | 9.90% | 6.48% |
| 2014 | 77.54% | 4.60% | 9.45% | 6.33% |
| 2015 | 77.32% | 4.42% | 9.30% | 6.38% |
| 2016 | 77.19% | 4.65% | 9.96% | 6.57% |
| 2017 | 78.10% | 3.80% | 9.40% | 6.98% |
| 2018 | 77.18% | 3.71% | 10.43% | 6.75% |
| 2019 | 76.35% | 4.13% | 10.62% | 6.35% |
Average Age Of A Therapist
The average age of a therapist in the U.S. is 41 years old.

Below is a chart that shows the average age of a therapist by race:
| Race | Male Age | Female Age |
| Unknown | 33 | 33 |
| White | 40 | 40 |
| Black or African American | 40.5 | 40.5 |
| Asian | 42 | 42 |
| Hispanic or Latino | 38.5 | 39 |
Therapist Education Levels
The most common degree a therapist has is a bachelor's degree.

47% of therapists earn that degree. In second place is master's degree with 42% of therapists earning it, and third place is associate degree with 6% of therapists earning that degree.
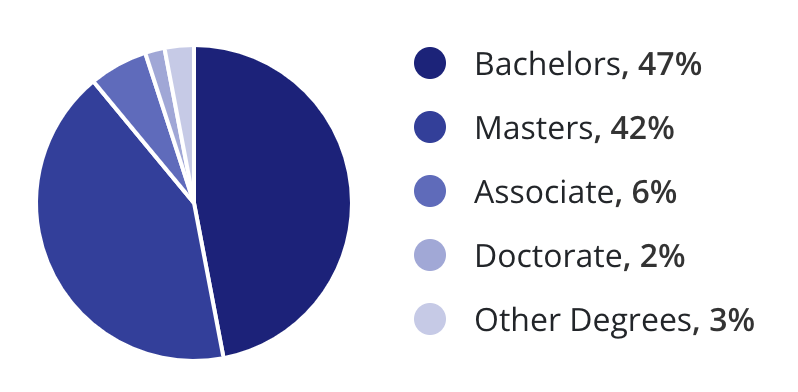
The chart below will help illustrate how educated therapists are:
| Therapist Degree | Percentages |
| Bachelors | 47% |
| Masters | 42% |
| Associate | 6% |
| Doctorate | 2% |
| Other Degrees | 3% |
Therapist Employment Statistics
Research shows that most therapists work for a private company, and the industry that employs the most therapists is the health care industry.
Size Of Companies That Hire Therapists
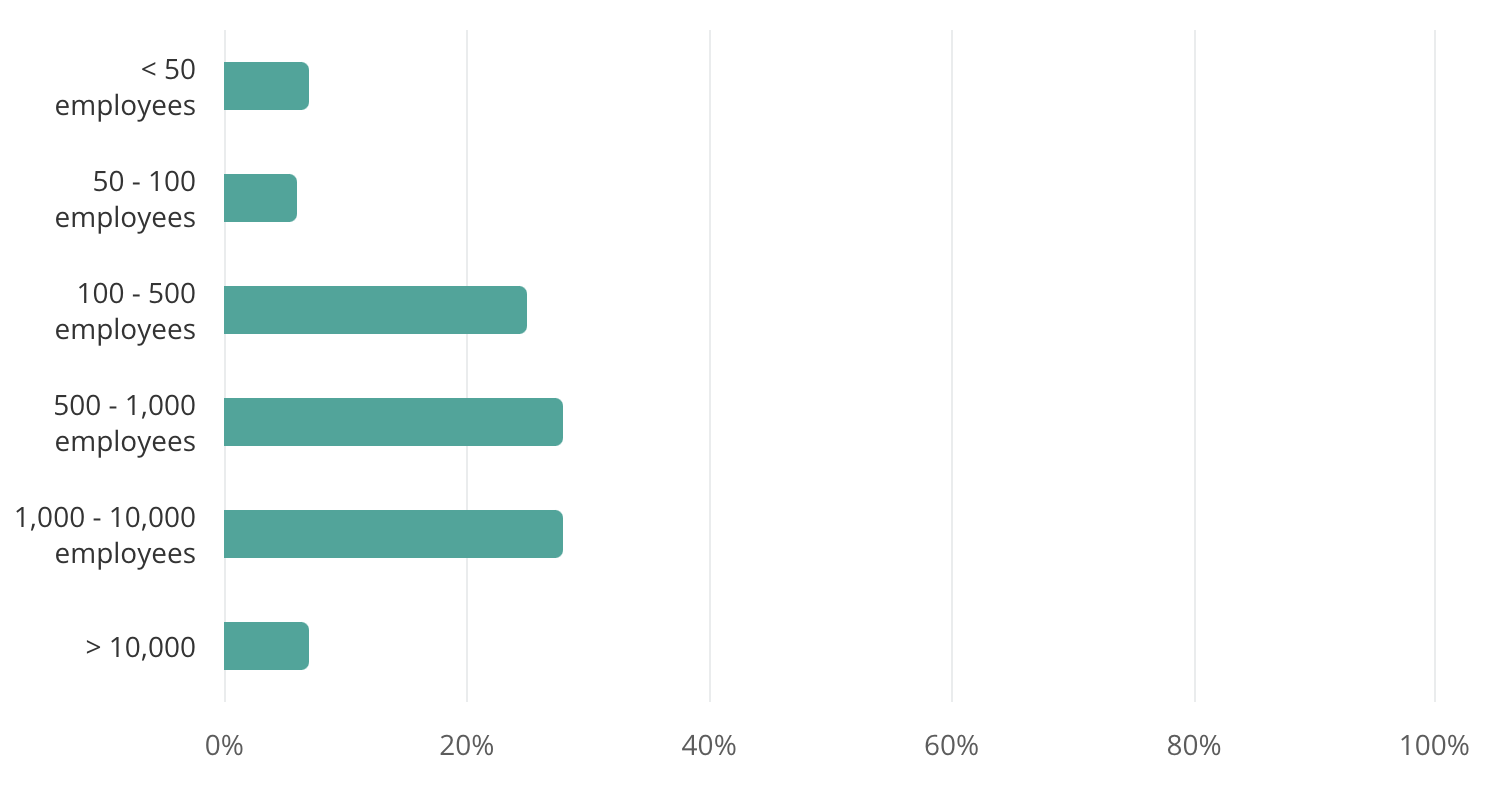
Therapist Jobs By Employer Size
| Company Size | Percentages |
| 50 employees | 7% |
| 50 - 100 employees | 6% |
| 100 - 500 employees | 25% |
| 500 - 1,000 employees | 28% |
| 1,000 - 10,000 employees | 28% |
| 10,000 employees | 7% |
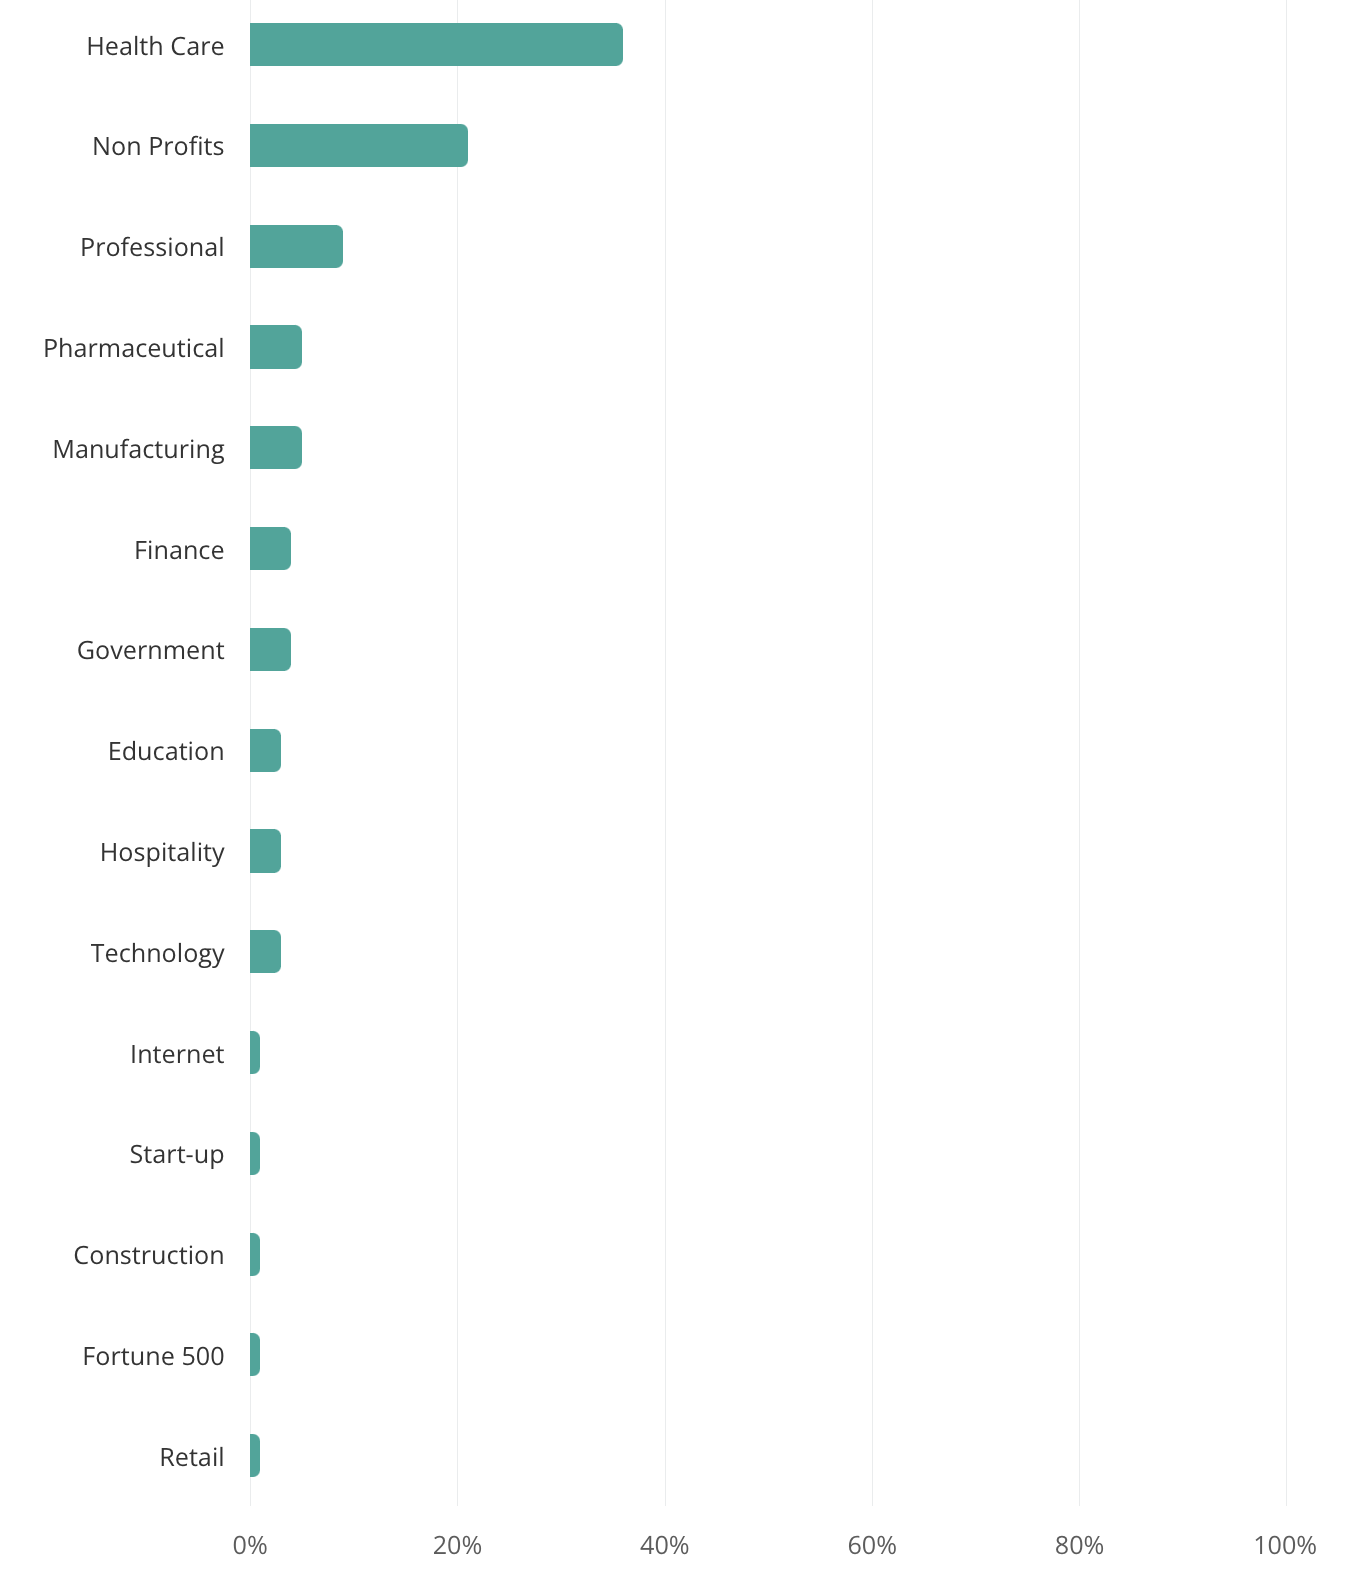
Top Industries Hiring Therapists
The most common industries that employ therapists include health care, non profits and professional according to Zippia, they were able to determine this by looking at the number of employees within each industry.
Therapist Unemployment Statistics
Between 2008 and 2018, this is how the number of therapists changed.
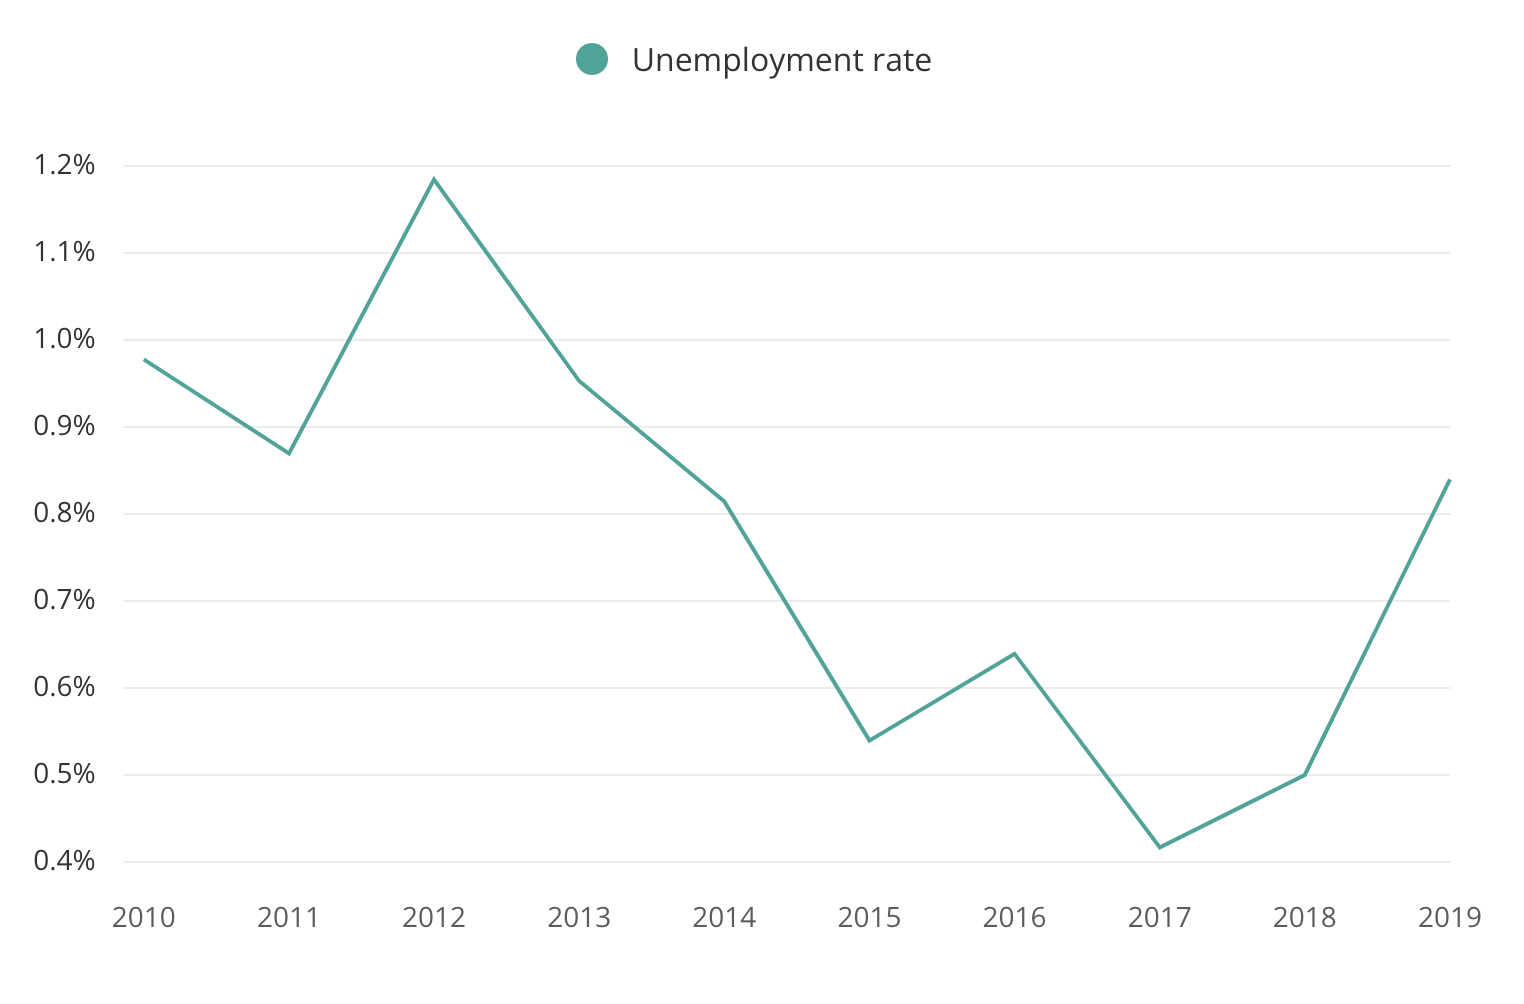
Below is a chart that shows unemployment rate in the therapy industry over time:
| Year | Therapist Unemployment Rate |
| 2010 | 0.98% |
| 2011 | 0.87% |
| 2012 | 1.18% |
| 2013 | 0.95% |
| 2014 | 0.81% |
| 2015 | 0.54% |
| 2016 | 0.64% |
| 2017 | 0.42% |
| 2018 | 0.50% |
| 2019 | 0.84% |
So, How Many Therapists Are There?
There are more than 198,811 therapists and more than 81,000 psychologists in the US.
Therapists can help people going through many types of challenges in life, including different types of addiction, alcohol abuse, mental health, motivation, and more. Imagine a world without therapists...it would be much harder without them. We put together this roundup of therapist statistics to show you how many there are, how much they earn, their demographics, and much more.